
Martyn Richard Jones
San Martiño de Bandoxa
19th April 2020

ADVERT:
LAUGHING@BIGDATA – THE GREATEST DATA STORY EVER TOLD!
A new ebook about Agile, AI, data, deep learning, IT, machine learning and more.
It’s highly polemic, contrarian and insightful. It informs, educates and entertains. And there’s a lot of it. You won’t be left indifferent.
Here’s an update on developments.

For greater convenience my Brand new ebook Laughing@BigData (Kindle Edition) is now available at the following Amazon locations:
USA (around 9.98 USD): https://www.amazon.co.uk/dp/B086HS6VWX
United Kingdom (around 7.99 GBP): https://www.amazon.co.uk/dp/B086HS6VWX
Germany (around 8.99 EUR): https://www.amazon.de/dp/B086HS6VWX
France (around 8.99 EUR): https://www.amazon.fr/dp/B086HS6VWX
Spain (around 8.99 EUR): https://www.amazon.fr/dp/B086HS6VWX
Italy (around 8.99 EUR): https://www.amazon.it/dp/B086HS6VWX
Netherlands (around 8.99 EUR): https://www.amazon.nl/dp/B086HS6VWX
Japan (around 1,099 YEN): https://www.amazon.co.jp/dp/B086HS6VWX
Brazil (around 24.99 BRL): https://www.amazon.com.br/dp/B086HS6VWX
Canada(around 9.99 CAD): https://www.Amazon.ca/dp/B086HS6VWX
Mexico (around 149.99 MXN): https://www.amazon.com.mx/dp/B086HS6VWX
Australia (around 10.99 AUD): https://www.amazon.com.au/dp/B086HS6VWX
India (around 449 INR): https://www.amazon.in/dp/B086HS6VWX
Please consider sharing these links and a recommendation with friends, connections, groups, colleagues, partners, peers, family and bosses.
Oiling the wheels-of-industry during COVID-19.
Thanks a million! Stay safe and keep well!
Martyn
To begin
There are many common misconceptions amongst the Big Data Collective and the Data Lake/Lakehouse Massive about what traditional data warehousing was about and what contemporary data warehousing signifies.
We have plenty of common fallacies out in the wide wild world that need clearing up. That has to be done in order to avoid unnecessary confusion and avoidable risks. By informing, educating and entertaining, I hope to neutralise the fake news, post-fact and truthiness about data warehousing which damages data warehouse projects. And I hope that this puts a brake on the nonsense that is negatively affecting the reputation of the solution framework, process and architecture.
Big picture
Let’s look at an analogy of data warehousing and getting data to where it is wanted.

Figure 1 – data warehousing aligns with a proven paradigm – ENLARGE
Please note that this isn’t strictly analogous to the contemporary EDW 4.0 approach (which is very much still Inmon based). But it serves to illustrate the main concepts of good sense enterprise data warehousing.
In the dim and distant past of business IT, the best information that senior executives could expect from their computer systems were operational reports. These would typically indicate what went right or wrong or somewhere in between. Applied statistical brilliance made up for what data processing lacked in processing power, up to a point because even heavy-lifting statistics required computing horsepower. Something which in those days was a question of serious capital outlays. Spending on a scale that not all companies were willing or able to sanction.
Then, and curiously coincidentally, people around the world started to posit the need for using data and information to address significant business challenges. Such as providing input to strategy formulation, choice and execution. Reports would no longer just be for the Financial Directors or the paper collectors but would support serious business decision making.
Many initiatives sprang up to meet the critical decision-making data requirements; they were invariably expensive attempts, with variable outcomes. Some approaches were quite successful, but far too many failed, until the advent of data warehousing.
Back then, most of the data that could potentially aid decision-making was in operational systems. This predicament was both an advantage and a problem. Data in operational systems was like having data in gaol. Getting data into operational systems was relatively easy; getting it out and moving it around was a nightmare. However, one of the advantages of operational data was that they were generally stored in a structured format, even if data quality was frequently dubious. And ideas such as subject orientation and integration were far from widespread.
Of course, data also came in from external sources, but usually via operational databases as well. An example of such are instrument pricing data in financial services.
Therefore, briefly, a lot of data warehousing started as a means to provide data to support strategic decision-making. Data warehousing was not about counting cakes, widgets or people. All of which were in the purview of operational reporting, or to measure sentiment, likes or mouse behaviour. But to assist senior executives, address the significant business challenges of the day.
Who invented the data warehouse?
Bill Inmon, the father of data warehousing, defines it as being “a subject-oriented, integrated, time-variant and non-volatile collection of data in support of management’s decision-making process.”
Subject Oriented: The data in the data warehouse are organised conceptually (the big canvas), logically (detailing the big picture and) and physically (detailing how it is implemented). This is done by subjects of interest to the business, such as customer, product, business-direction and transaction.
The thing to remember about subject areas is that they are not created ad-hoc by IT. Or according to the sentiments of the time. For example, during requirements gathering, but through a deeper understanding of the business, its processes and its pertinent business subject areas.

Figure 2- Subject oriented – ENLARGE
Integrated: All data entering the data warehouse is subject to normalisation, integration rules and constraints. These considerations are to ensure that the cleaned and complete data stored are consistently and contextually unambiguous.

Figure 3 – Integrated – ENLARGE
Time-Variant: Time variance gives us the ability to view and contrast data from multiple viewpoints over time. They are necessarily snapshots in time. It is an essential element in the organisation of data within the data warehouse and dependent data marts.

Figure 4- Time-variant – ENLARGE
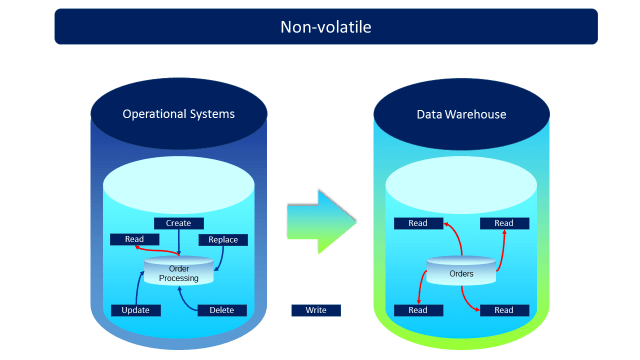
Non-Volatile: The data warehouse represents a structured and consistent snapshot of business data over time. Once a data snapshot gets established, it is rarely if ever modified.

Figure 5 – Non-volatile – ENLARGE
Management Decision Making: This is the principal focus of data warehousing, although data warehouses have secondary uses, such as complementing operational reporting and analysis.
So put into everyday language. If what business has or is planning to have does not satisfy the Inmon criteria, then it probably is not a data warehouse you are getting. But rather another form of data-store.
The thing to remember about informed management decision making is that it needs to be as good as required. Still, it does not need to achieve technical perfection. This observation reinforces the fact that data warehousing is a business process. And is not an obsessive search for zero defects or the application of “leading edge” technologies whether those technologies are faddish, delightful or cute – or not.

Figure 6 – From source to decision maker – ENLARGE
Some basic data warehousing terms
Before we delve into the meaning of data warehousing, there are a couple of terms that need to be understood first, so, by way of illustration:

Figure 7- Simplistic flow – ENLARGE
Let’s follow the numbers in the simplification of the process.
- We gather specific and well-bound data requirements from a particular area of business. These are requirements gathered by talking to business people. Here we try and understand the data requirements from a business point-of-view. But we also look at the needs of data sourcing and data logistics perspectives. Here we must remember at all times, not to over-promise or to set expectations too high. We must be modest, practical and realistic. And, we must be able to answer, in an adequate way, the question “to what ends?”
- These business requirements are typically captured in a dimensional data model and supporting documentation. Remember that all requirements are subject to revision at a later date. And, usually in a subsequent iteration of a requirements-gathering to implementation cycle.
- We identify the best source(or sources) for the required data, and we record necessary technical, management and quality details. We ensure that we can provide data to the quality required. Note that data quality does not mean perfection but data to the required quality tolerance levels.
- Data warehouse data models are modified as required. This is done to accommodate any new data stored at an atomic level.
- We define document and produce the means (ETL) for getting data from the source and into the target data warehouse. Here we also pay special attention to the four characteristics of data warehousing. ETL is an acronym for extract, transform and load (not to be confused with ELT).
- Extract is getting the data from the data source to a staging area – typically. This can also be the fourth tier of the data warehouse.
- Transform is about the data, making them subject-oriented, integrated, and time-variant.
- And Load is about getting the data into the data warehouse and data marts.
- We define document and produce the means for getting data from the data warehouse into the data mart. In short, this is simply a bit more ETL.
- User acceptance testing. NB Users must ideally be involved in all parts of the end-to-end process that requires business requirements, participation and validation. Test early and test often to avoid nasty surprises.
These seven points represent a very simplified view, but it serves to convey the fundamental chain of events. The most important aspect is that we start (1) and end (7) with the user. And, we fully involve them in the non-technical business and data aspects of the process.
Business, enterprise and technology
So, you see. A data warehouse is essentially a business-driven, enterprise-centric and technology-based solution. And it is used to provide continuous quality improvement in the sourcing, integration, packaging and delivery of data for strategic, tactical and operational modelling, reporting, visualisation, analytics, statistics and decision-making.
Business-driven
A data warehouse is business-centric, and nothing happens unless there is a business imperative for doing so. This tenet means that there is no second-guessing the data requirements of the business. And it means that every piece of data in the data warehouse should be traceable to a tangible business requirement. This concrete business requirement is usually a departmental or process-specific dimensional data model produced together in requirements workshops with the business. We build the data warehouse over time in iterative steps. We do so based on the criteria that the requirements should be small enough to be delivered in a short timeframe and large enough to be significant to the business. Data warehousing is not about grand gestures.
Typically, a data warehouse iteration results in a new data mart or the revision of an existing data mart.
Enterprise centric
As we build up the collection of data marts, we are also building up the central store of data known as the enterprise data warehouse. This repository then serves as a structured, coherent and cohesive central clearing area for data that supports enterprise decision making. And as you can see, while we are addressing specific departmental and process requirements through data marts, we are also building up an overall view of the enterprise data.
Technology-based
By technology, I mean technology in the broadest sense of techniques, methods, processes and tools, and not just a question of products, brands or badges.
Unfortunately, there is a popular misconception that data warehousing is primarily about competing popular and commercially available technology products. It isn’t, but they do play an important role.
Architecture
The following is an example of a very high-level data warehouse architecture diagram.

Figure 8 – Augmented Classic Data Warehouse – 2007 – ENLARGE
Methodologies
Various methodologies support the building, expansion and maintenance of a data warehouse. Here is one example of a professional data integration methodology, produced, maintained and used by Cambriano Energy.

Figure 9 – Iterative process model for building the data warehouse – ENLARGE
And here is an information value-chain map as used by Cambriano Energy as part of its Iter8 process management. There are alternatives, many of which do a satisfactory job.

Figure 10 – A chain of management data – ENLARGE
Last but not least, this was (from memory) the way that Bill Inmon’s Prism Solutions ETL Company used to view the iterative EDW building process.

Figure 11 – The Inmon View – ENLARGE

Figure 12 – The Inmon View – ENLARGE
Keeping it shortish
At this point, I decided to cut-short further explanations on aspects of data warehousing. However, if you have any question, then please address them to me, and I will do my best (or something close) to answer them.
I will be expanding on Data Warehousing 4.0 in my book on data which will be coming out later in the year.
That’s all, folks
Hold this thought for another time. Just because you have what you call a data warehouse, doesn’t mean you have one. For as fast and cheap as it is. Then you still don’t have a data warehouse to show for your efforts.
That is not a great place to be.
Therefore, data warehousing was never about a haphazard approach to providing randomly structured, semi-structured and unstructured data. And of various qualities, provenance, volumes, varieties and velocities. And for whoever was of a mind to want it.
And doing so is not a good look.
Many thanks for reading.
Discover more from GOOD STRATEGY REBELLION
Subscribe to get the latest posts sent to your email.
Pingback: Modern Data Warehouse 101 – Understanding the Basics - Actual Tecnología